Metrics, Logs and Traces
What each signal answers, why percentiles beat averages, how histograms work, and where cardinality and sampling send the bill.
10 lessons · about 85 minutes
What you'll go through
- 01Twelve dashboards, and still nobody knows what broke8 min
- 02The number went down, and it can only ever go up8 min
- 03Average latency is 200 ms and the users are furious9 min
- 04Where the p99 actually comes from9 min
- 05One label added, and the bill tripled8 min
- 06grep worked with one server and gave up at forty8 min
- 07The log that answers nothing, and the one that leaks a password8 min
- 08The request took three seconds and every service swears it was fast9 min
- 09Watching the service now costs more than running it8 min
- 10From alert to cause, using all three10 min
Included in this pack
Observability — Metrics, logs and traces; SLOs and alerts; and what to do during an incident. Three courses, 30 lessons.
Also in this pack
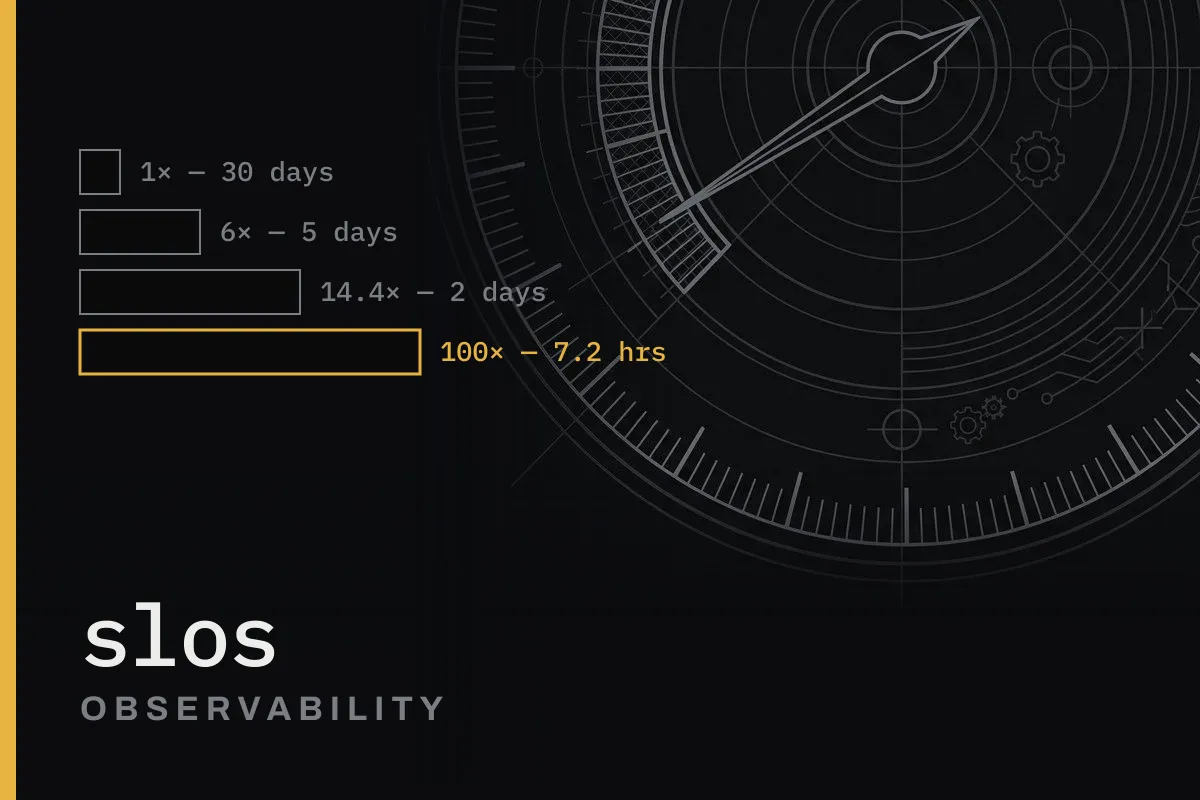
SLOs and Alerts
Indicators, targets, error budgets, burn-rate alerting, what an alert must contain, and who gets woken up.
10 lessons · ~85 min$19.90
Incident Response
The first five minutes, blast radius, cascades, graphs that mislead, partial failures, mitigation, communication and the post-mortem.
10 lessons · ~90 min$19.90